Now that we understand the basic algorithm for computing the Mandelbrot set, we can turn to its implementation. Let’s start with the Mandelbrot iteration
which computes a sequence of complex numbers. Instead of defining a custom data type for representing complex numbers we take the slightly simpler route and implement the necessary operations directly. To do this, we first split the numbers \(z_k\) and \(c\) into
their real and imaginary parts by writing \(z_k=x_k + \I y_k\) and \(c=c_x+\I c_y\) and then expand the expression \(z_{k-1}^2+c\) using the rules of complex arithmetic. This gives us two new sequences, one for the real parts \(x_0,x_1,\ldots \) and one for the imaginary parts \(y_0,y_1,\ldots \):
Since all numbers and variables that occur in Eq. (2.6) are real-valued, the expressions can be translated directly into Java code that operates on floating-point numbers.1
We start in Listing 2.1 with the implementation of a function escapeTime() that computes the escape time of a complex number \(c\). The first two arguments cx
and cy are the real and imaginary parts of \(c\), and the third argument maxIter is the iteration limit. The return value of escapeTime() is either the number of iterations at which the trajectory leaves the escape radius or maxIter if the trajectory doesn’t escape. To check whether the complex number \(z_k\) lies outside the escape radius, the function compares the squared length \(|z_k|^2=x_k^2+y_k^2\) to the square of the escape radius. Comparing squared lengths (or distances) instead of regular lengths is a common programming trick that saves one square root per comparison. Especially for programs
that would otherwise have to compute a large number of square roots, this is a simple but effective optimization.
Listing 2.1ch2 / MandelbrotSet
public static int escapeTime(double cx, double cy, int maxIter) {
    double escapeRadius = 2.0;
    double xn = 0.0, yn = 0.0;
    for (int k = 0; k < maxIter; k++) {
        if (xn * xn + yn * yn > escapeRadius * escapeRadius)
            return k;
        double x = xn, y = yn;
        xn = x * x - y * y + cx;
        yn = 2 * x * y + cy;
    }
    return maxIter;
}
We can now draw an image of the Mandelbrot set by iterating over each pixel and setting its color based on the escape time of the corresponding complex number. Suppose we want to draw the Mandelbrot set in a certain rectangular region of the complex plane and produce a
raster image that is \(w\) pixels wide and \(h\) pixels high. Figure 2.4 illustrates how we translate between pixels and complex numbers: We first divide the region into a grid of \(w\times h\) pixels, and then
compute the coordinates of the complex number at the center of each square.
Figure 2.4 Sampling the Mandelbrot set. To create a raster image of the Mandelbrot set, we divide a region of the complex plane into \(w\times h\) pixels and compute the escape time of the number at the center of each square.
The drawMandelbrot() function shown in Listing 2.2 implements these computations. The function takes three arguments: The
first is the region of the complex plane to be drawn, the second argument colors[] specifies the color palette that maps escape times to colors, and the last is the image we are drawing into.2 The
function starts by computing the size of each pixel and the coordinates xMin and yMin of the complex number at the center of the lower-left pixel. We assume that the array colors specifies one color for each
possible escape time, so we set the iteration limitmaxIter to the index of the last entry in colors; this last entry holds the color that is used for the interior of the Mandelbrot set and is conventionally set to black.
The function then iterates over the pixels of image and colors them according to the escape time of the corresponding complex number.
Listing 2.2ch2 / MandelbrotPainter
public static void drawMandelbrot(Rectangle region, int[] colors,
        BufferedImage image) {
    double pixelWidth = region.width() / image.getWidth();
    double pixelHeight = region.height() / image.getHeight();
    double xMin = region.bottomLeft().x() + pixelWidth / 2;
    double yMin = region.bottomLeft().y() + pixelHeight / 2;
    int maxIter = colors.length - 1;
    for (int y = 0; y < image.getHeight(); y++) {
        for (int x = 0; x < image.getWidth(); x++) {
            int escapeTime = MandelbrotSet.escapeTime(
                    xMin + x * pixelWidth, yMin + y * pixelHeight,
                    maxIter);
            image.setRGB(x, image.getHeight() - 1 - y,
                    colors[escapeTime]);
        }
    }
}
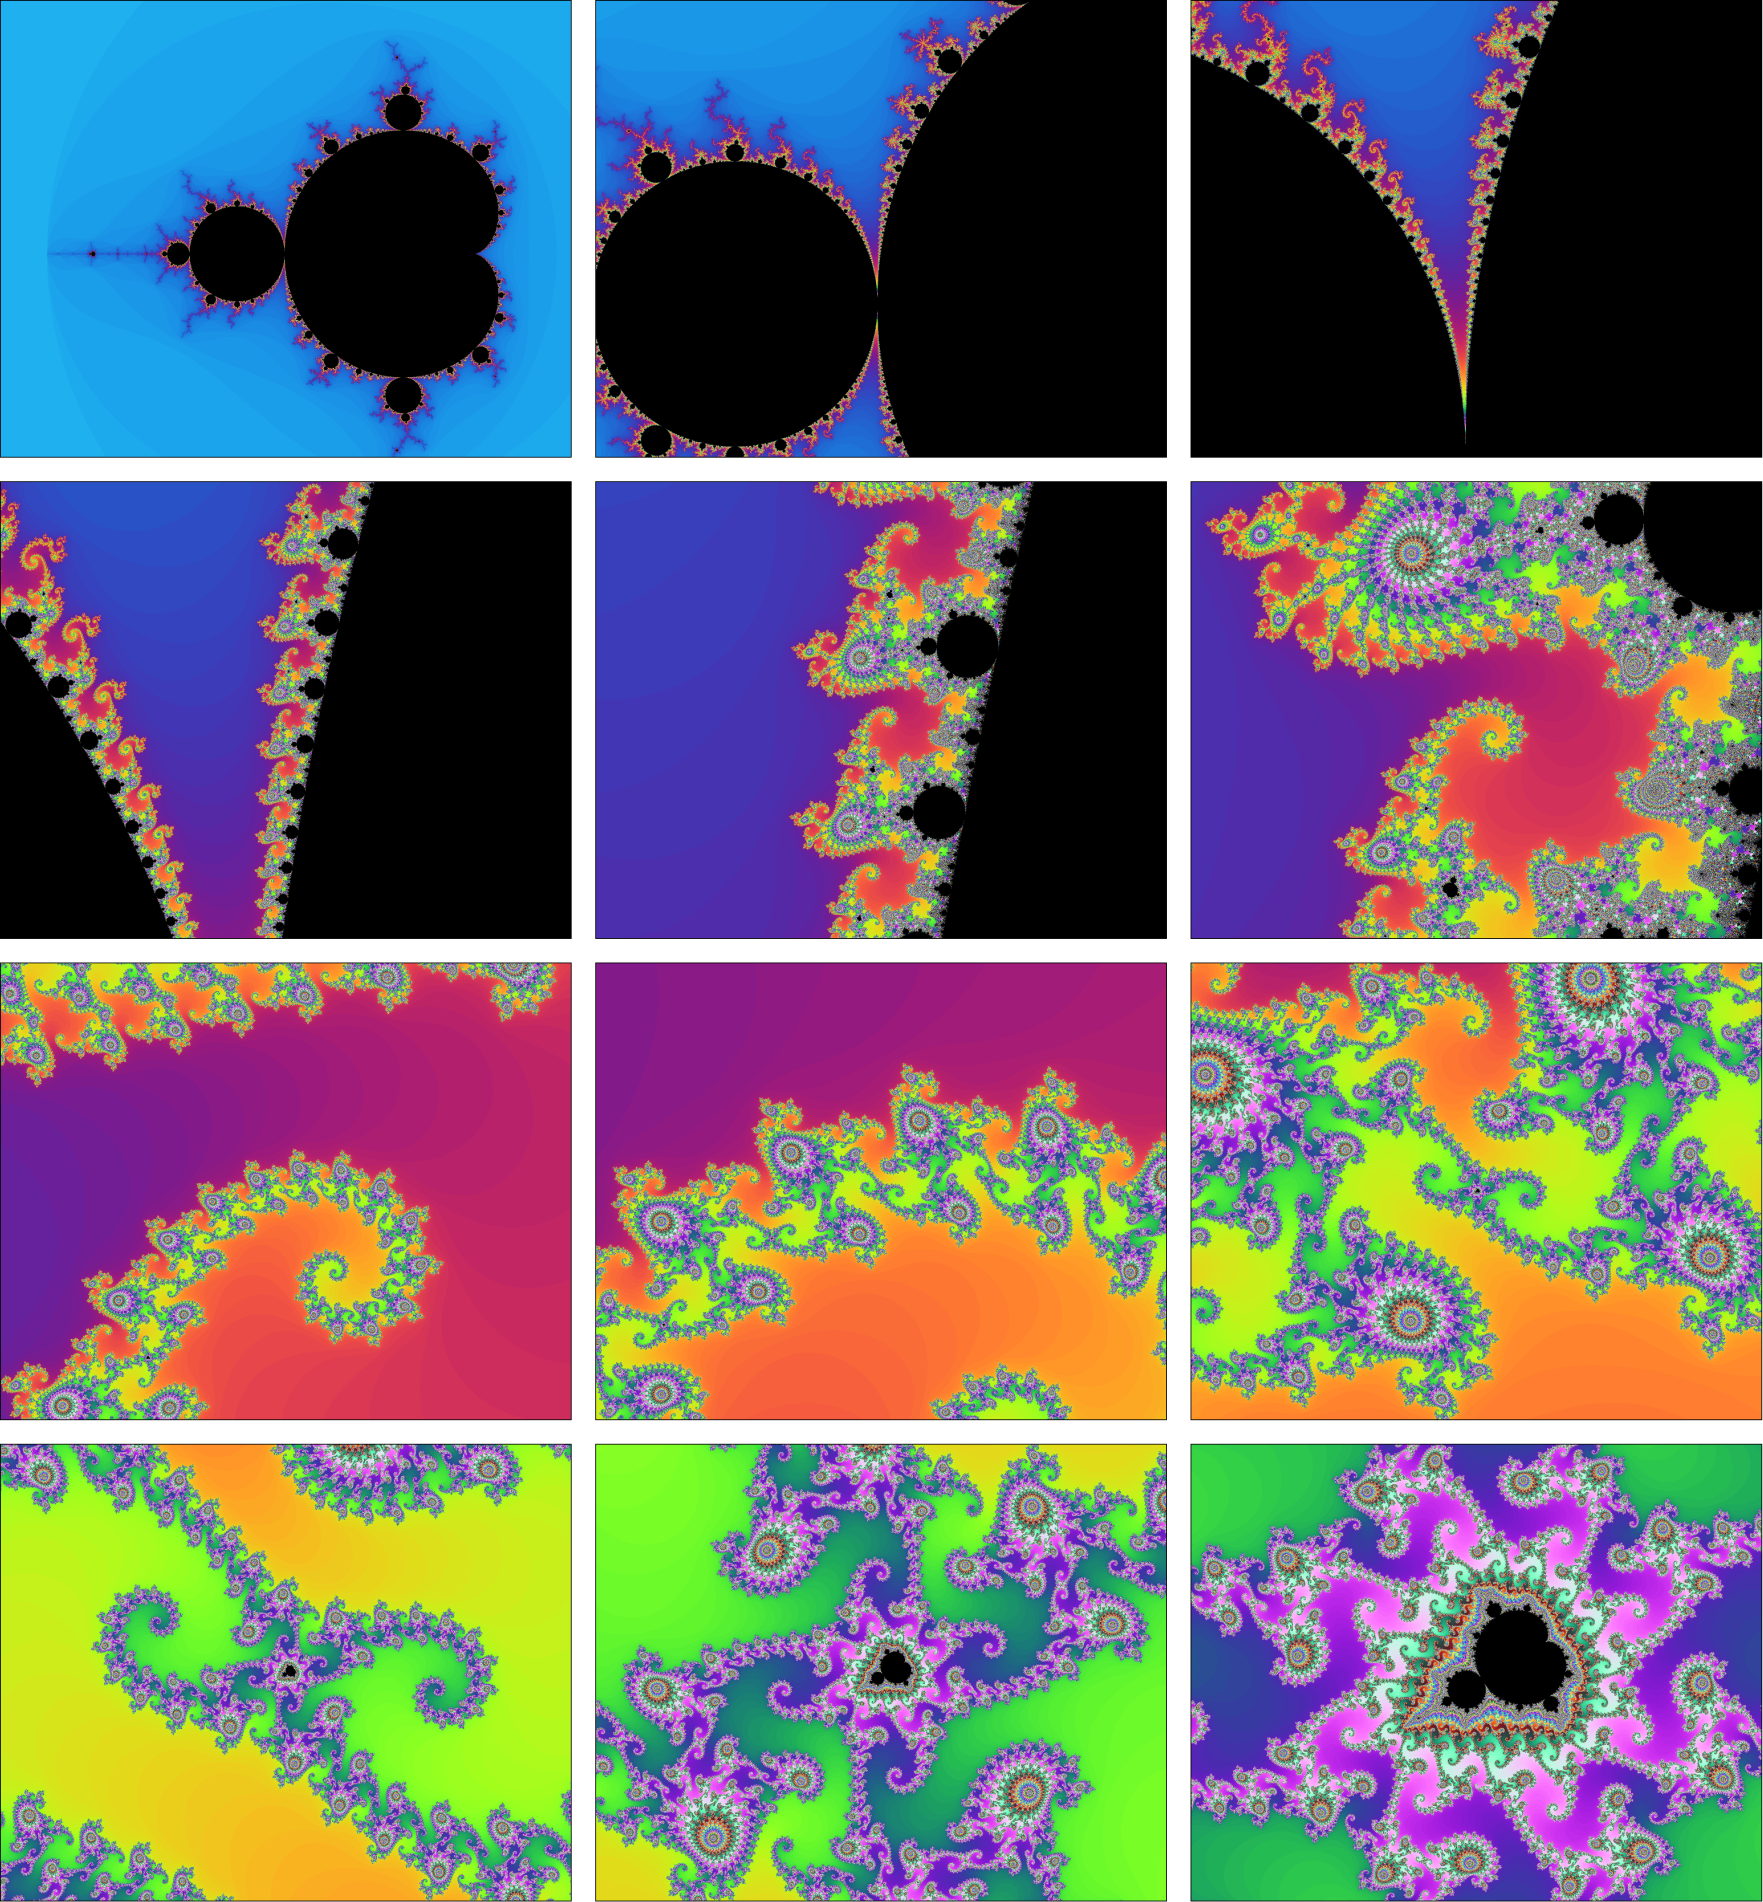
Finally, let us use drawMandelbrot() to create a series of images that zooms into a particular region of the Mandelbrot set, as shown in Fig. 2.5. Each image magnifies the central region of the previous image by a factor of 2.5, so the total magnification of the last image in the lower-right corner is \(2.5^{14}\approx 370\,000\).
Figure 2.5 Zooming into the Mandelbrot set. Each image magnifies the center of the previous image by a factor of \(2.5\). The limiting point is the complex number \(-0.5364866407792761+0.5230664066236846\I \). The gradient shown at the bottom was used to map escape times to colors.
To create such a sequence of images, we call drawMandelbrot() multiple times and in each step shrink the region that is being drawn by a constant factor while keeping the center fixed. The
corresponding rectangles in the complex plane can be computed as shown in Listing 2.3. The function first computes the width and height of the rectangle in the complex domain. The “magic constant” 2.25 used in the computation of
width is chosen so that a magnification of 1 produces a rectangle that encloses the entire width of the Mandelbrot set. The height of the of the region is then obtained by scaling width by the aspect ratio of the resulting image, that is, the ratio of its width to its height. We can then easily compute the lower-left and upper-right corners of the region in the complex plane, which are used to initialize the Rectangle returned from the function.
Listing 2.3ch2 / MandelbrotPainter
public static Rectangle zoomRect(Point center, double magnification,
        int imageWidth, int imageHeight) {
    double w = 2.25 / magnification;
    double h = w / imageWidth * imageHeight;
    return new Rectangle(
            new Point(center.x() - w / 2, center.y() - h / 2),
            new Point(center.x() + w / 2, center.y() + h / 2));
}
We can now create a series of images that keep the center fixed and repeatedly increase the magnification by a constant factor:
var center = new Point(-0.5364866407792761, 0.5230664066236846);
double magnification = 1.0;
for (int i = 0; i < 10; i++) {
    var region = zoomRect(center, magnification,
                          image.getWidth(), image.getHeight());
    drawMandelbrot(region, colors, image);
    // Display or save image
    magnification *= 2.5;
}
1 Exercise 2.2 asks you to derive these equations yourself.
2 The Rectangle type was introduced in Exercise 1.4.
Exercises
Exercise 2.2. Use the rules of complex arithmetic to show that the two versions of the Mandelbrot iteration in (2.5) and (2.6) are equivalent.
Exercise 2.3. The Mandelbrot set can be rendered in countless different ways by changing the mapping from escape times to colors. Create images
with different color mappings (\(k\) is the escape time):
1.Black and white: black if the number belongs to the Mandelbrot set and white otherwise.
2.Grayscale: either increase the intensity linearly with \(k\) or use an oscillating function such as \(0.5 + 0.5\sin (2k)\).
3.Color: for each color channel, vary the intensity using the function \(0.6 + 0.4\cdot \cos (f_c\cdot k + \phi _c)\), where \(f_c\) and \(\phi _c\) denote independent parameters for the red, green, and blue channels. (The colored images in this
chapter were generated using \(f_{rgb}=(0.05, 0.04, 0.03)\), and \(\phi _{rgb} = (2.8, 1.7, 0.5)\).)