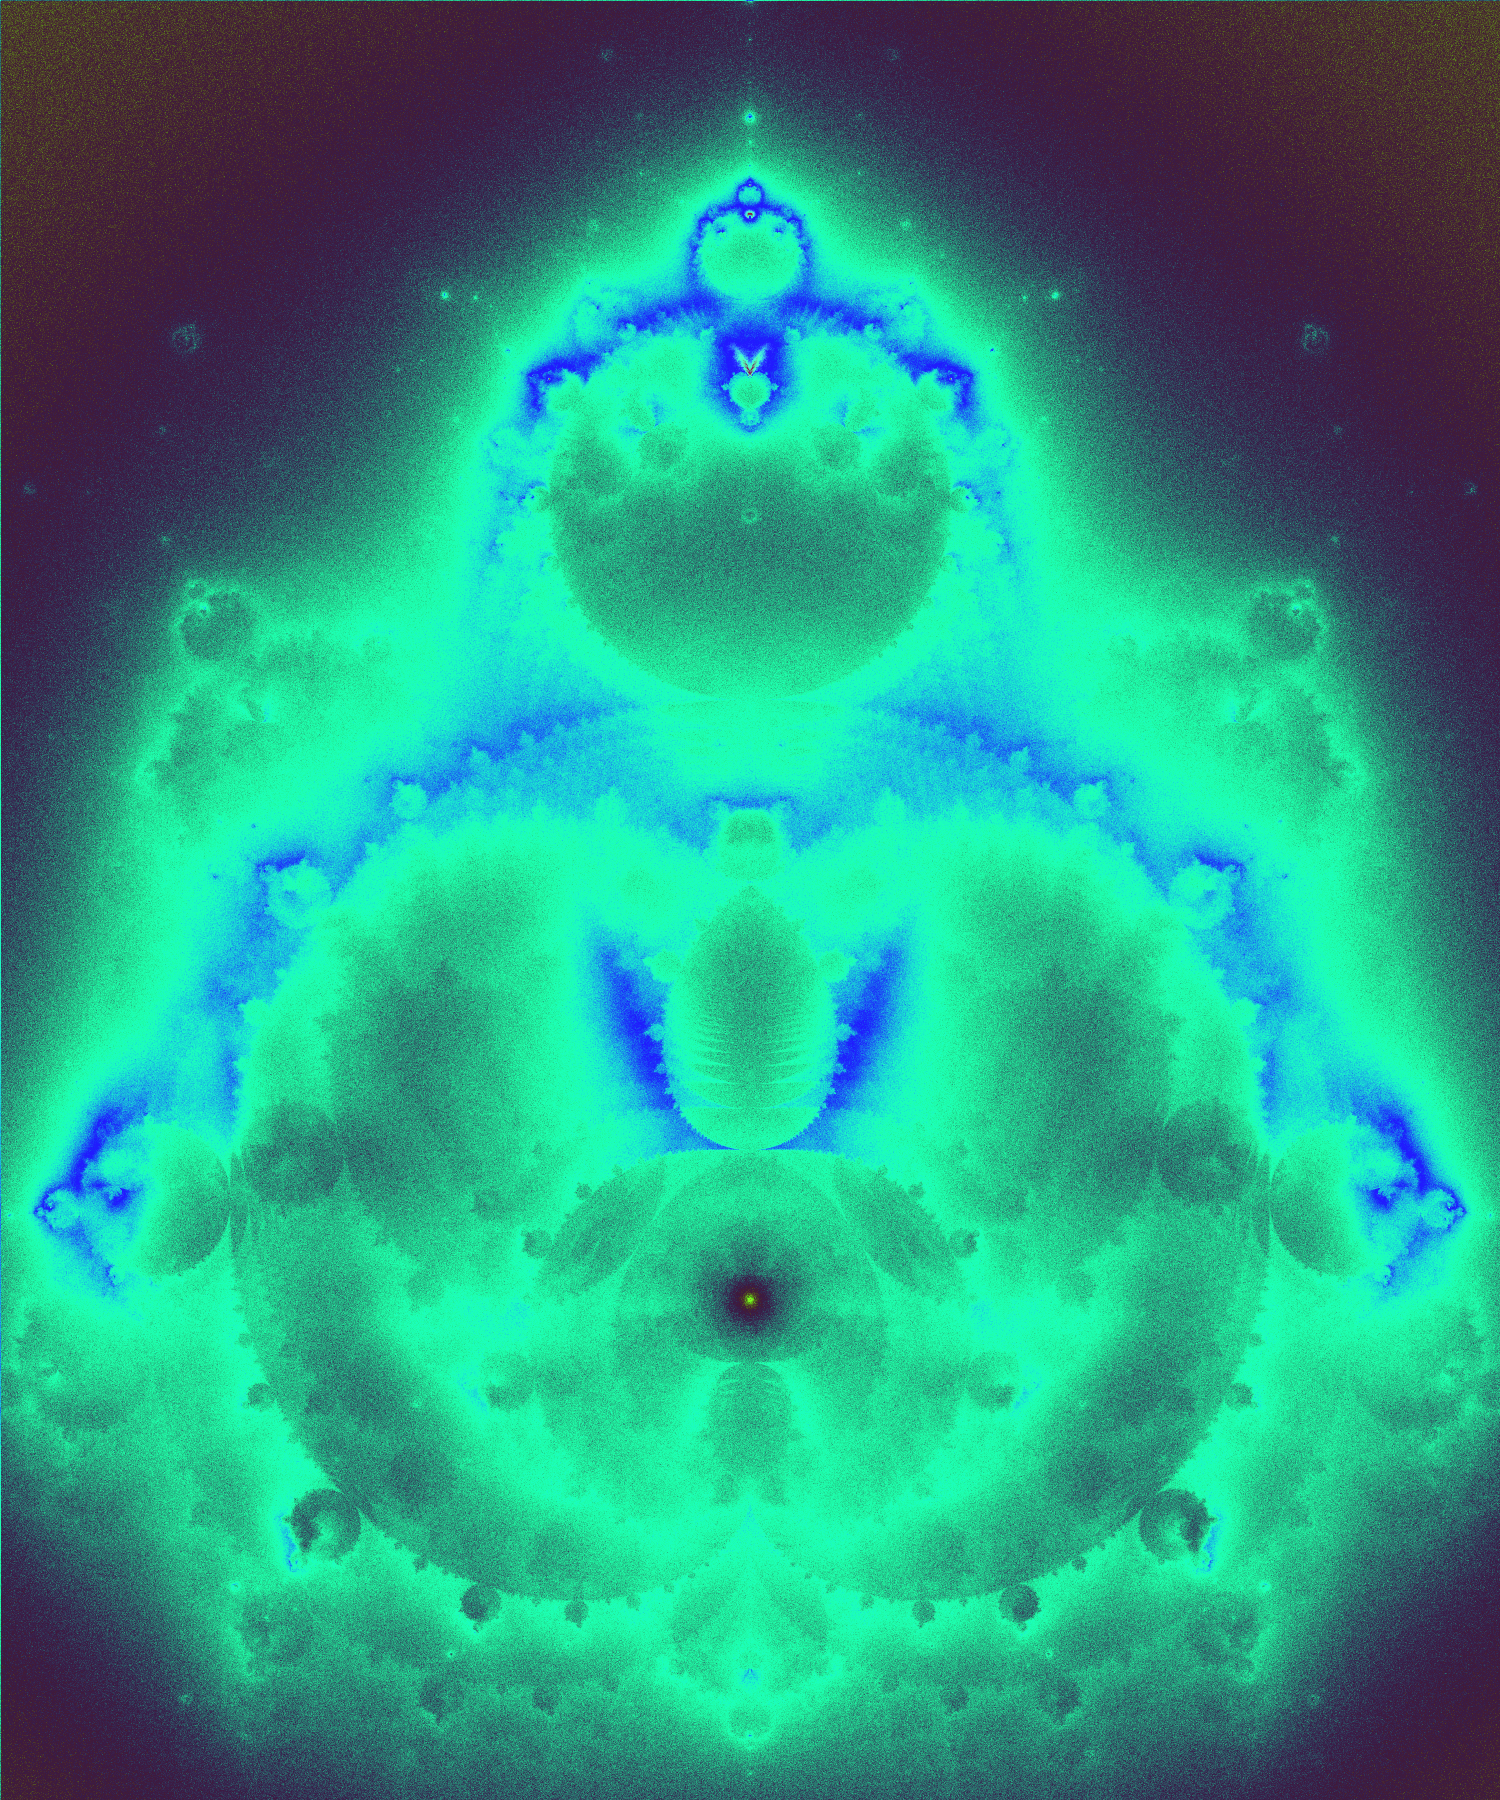
As a final example of iteration and fractals, let’s take a look at a particularly interesting method for visualizing the Mandelbrot set that visualizes not just the escape time but the way the Mandelbrot iteration distributes points over the complex
plane. The result is the Buddhabrot, shown in Fig. 2.6, which owes its name to the fact that the resulting shape resembles a sitting Buddha.3
Figure 2.6 The Buddhabrot. This visualization of the Mandelbrot iteration indicates how frequently the iteration visits different regions of the plane.
To draw the Buddhabrot, we focus our attention on unbounded trajectories of the Mandelbrot iteration in Eq. (2.5). Recall that unbounded trajectories are
characterized by the fact that they eventually leave the escape radius, but before they disappear from view, they visit a finite set of numbers inside the escape radius. The Buddhabrot shows which numbers are, on average, visited most frequently: The complex numbers in the
bright regions of Fig. 2.6 are traversed more frequently than those in the dark regions.
To compute the Buddhabrot, we divide the region of the complex plane we want to display into pixels as before, but this time we associate a counter with each pixel. We then generate a random complex number inside the escape radius and compute
its the trajectory using the normal Mandelbrot iteration. If the trajectory is bounded we ignore it, but if it is unbounded we take each complex number on the trajectory, determine the corresponding pixel, and increase its counter. If we repeat this process for many random trajectories, we obtain a histogram that reflects how complex numbers are distributed by the Mandelbrot iteration.
Since the code for computing the Buddhabrot is slightly more complex than the one for the regular Mandelbrot set, we collect all the required data and functions in a class called Buddhabrot (Listing 2.4). As before, the imageWidth and imageHeight fields hold the width and height of resulting image, and region is the region in the complex plane that is being displayed. The constructor Buddhabrot() initializes imageWidth and imageHeight directly and computes a suitable region of interest using the zoomRect() method, which we already used to compute a region of interest for the Mandelbrot set.
Listing 2.4ch2 / Buddhabrot.java
// A class for computing the Buddhabrot.
public class Buddhabrot {
    private final int imageWidth;   // width of final image
    private final int imageHeight;  // height of final image
    private final Rectangle region;  // region of interest

    private Buddhabrot(int imageWidth, int imageHeight) {
        this.imageWidth = imageWidth;
        this.imageHeight = imageHeight;
        region = MandelbrotPainter.zoomRect(new Point(-0.5, 0.0), 1.0,
                imageWidth, imageHeight);
    }

    // ...
}
To compute an image of the Buddhabrot, we generate millions of random trajectories and count how often they traverse each pixel. To store the result we use a two-dimensional array of integers that is as large as the final image:
int[][] histogram = new int[imageHeight][imageWidth];
The followTrajectory() function defined in the Listing 2.5 computes a single trajectory that starts at the complex number \(c\) and increment the counters along its path. The arguments cx and
cy are the real and imaginary part of \(c\), and maxIter is the number of iterations we want to perform. The function starts by computing the size of a single pixel pixelSize and then performs the Mandelbrot iteration to compute the complex numbers
xn, yn along the trajectory. For every such number that lies inside the region of interest, the corresponding histogram entry is incremented; numbers outside of region are ignored.
Listing 2.5ch2 / Buddhabrot
// Increment histogram entries for trajectory starting at cx, cy.
private void followTrajectory(double cx, double cy, int maxIter,
        int[][] histogram) {
    double pixelSize = region.width() / imageWidth;
    double xn = 0.0, yn = 0.0;
    for (int k = 0; k < maxIter; k++) {
        double x = xn, y = yn;
        xn = x * x - y * y + cx;
        yn = 2 * x * y + cy;
        int row = (int) ((yn - region.bottomLeft().y()) / pixelSize);
        int col = (int) ((xn - region.bottomLeft().x()) / pixelSize);
        if (col >= 0 && col < imageWidth && row >= 0 && row < imageHeight)
            histogram[row][col]++;
    }
}
Each trajectory should start at a random point inside the escape radius. This presents us with the next problem: Most random number generators only produce real numbers in an interval, but we need to generate random points inside a circle.
How can this be done?
Let’s first discuss the solution for the unit circle, the circle of radius 1 that is centered at the origin. Every point inside this circle can be specified using polar coordinates \((r,\phi )\), where \(r\) is the distance of the point from the origin and \(\phi \) the angle it makes with the x-axis.4 A random point can then be generated by creating a
random number \(u\) between 0 and 1 and a random number \(\phi \) between 0 and \(2\pi \), and then converting back to Cartesian coordinates
\(\seteqnumber{0}{2.}{6}\)
\begin{equation}
x = \sqrt {u}\cos (\phi ),\qquad y = \sqrt {u}\sin (\phi ).
\end{equation}
The reason why the radius must be \(\sqrt {u}\) instead of simply \(u\) is easy to explain: The area of a circular disk grows quadratically with its radius, so the likelihood that a random point occurs at a certain distance from the origin must also increase quadratically with that distance. When
generating a random radius, we must therefore transform the uniform value \(u\) using the inverse function, the square root. Random points in circles of arbitrary size can be obtained by multiplying \(x\) and \(y\) by the desired radius.
The function shown in Listing 2.6 uses this technique to create a total of numTrajectories trajectories that start at random points inside the escape radius. Since the Buddhabrot uses only trajectories that escape after a finite
number of steps, we update the histogram using followTrajectory() only if the escape time is less than maxIter.
Listing 2.6ch2 / Buddhabrot
// Compute histogram of n random trajectories.
int[][] computeHistogram(int numTrajectories, int maxIter) {
    var histogram = new int[imageHeight][imageWidth];
    double escapeRadius = 2.0;
    for (int i = 0; i < numTrajectories; i++) {
        double angle = 2 * Math.PI * Math.random();
        double radius = escapeRadius * Math.sqrt(Math.random());
        double cx = radius * Math.cos(angle);
        double cy = radius * Math.sin(angle);
        int escapeTime = MandelbrotSet.escapeTime(cx, cy, maxIter);
        if (escapeTime < maxIter)  // unbounded?
            followTrajectory(cx, cy, escapeTime, histogram);
    }
    return histogram;
}
Now that we know how to compute the histogram of trajectories, we can draw an image of the Buddhabrot by mapping each histogram entry to a suitable color (Listing 2.7). Similar
to the way we colorized the Mandelbrot set, we map each histogram entry to a color from a fixed array of colors. A small but important difference is that the numerical range of the histogram entries is not known in advance, so we first determine the largest entry in the histogram maxValue and
use it to reduce every entry to a number in the range \([0,1]\).
Listing 2.7ch2 / Buddhabrot
public static void drawBuddhabrot(int numTrajectories, int maxIter,
        BufferedImage image, int[] colors) {
    var buddhabrot = new Buddhabrot(image.getWidth(), image.getHeight());
    var histogram = buddhabrot.computeHistogram(numTrajectories, maxIter);
    int maxValue = maximum(histogram);
    for (int y = 0; y < image.getHeight(); y++) {
        for (int x = 0; x < image.getWidth(); x++) {
            double v = (double) histogram[y][x] / maxValue;
            image.setRGB(x, image.getHeight() - 1 - y,
                    colors[(int) (v * (colors.length - 1))]);
        }
    }
}

static int maximum(int[][] array) {
    int max = Integer.MIN_VALUE;
    for (int[] row : array) {
        for (int value : row)
            max = Math.max(max, value);
    }
    return max;
}
Exercise 2.4.The Nebulabrot is an alternative rendering of the Buddhabrot that resembles an intergalactic nebula. The image is obtained by writing three versions of the Buddhabrot to separate color channels of the final RGB image: For
the red channel, the iteration limit is set to 5000, for the green channel to 500, and for the blue channel to 50. Write a program that computes the Nebulabrot.